Distribution of Physical Attractiveness: Does Beauty Follow a Bell Curve?
Physical attractiveness significantly influences social interactions, relationships, and even professional opportunities. A fascinating question arises: Is physical attractiveness normally distributed among the population? In other words, does it follow the classic bell curve pattern seen in traits like height and intelligence? This article delves into the research and theories surrounding this question, exploring how attractiveness is perceived and whether it aligns with statistical norms.
Understanding Normal Distribution
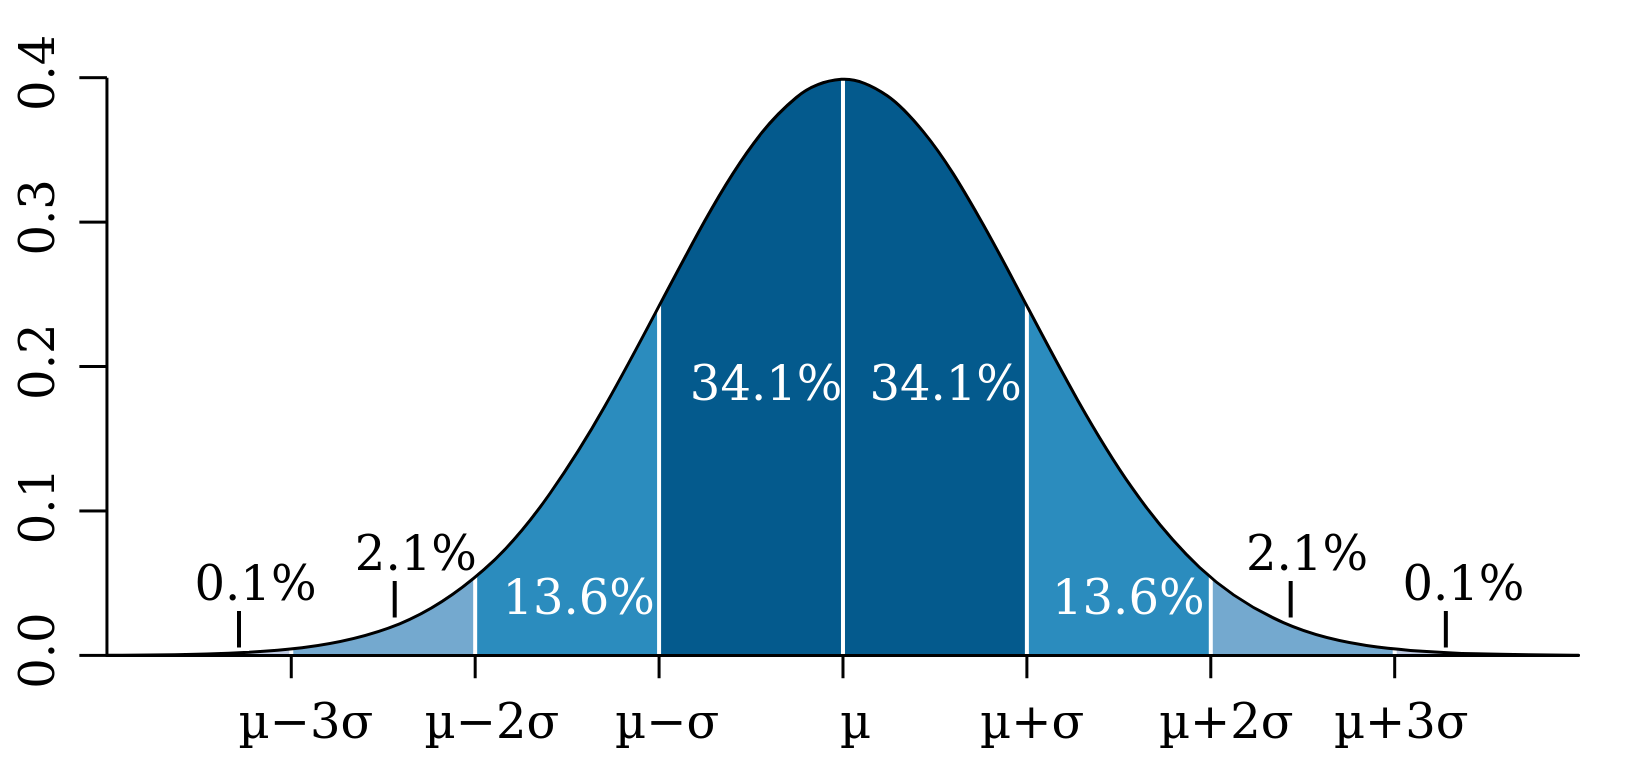
A normal distribution, or Gaussian distribution, is a statistical concept where data points are symmetrically distributed around a central mean, forming a bell-shaped curve. This pattern is common in natural traits due to the Central Limit Theorem, which states that the sum of many independent random variables tends toward a normal distribution, regardless of the original distribution of the variables.

Illustration of a normal distribution curve from Wikipedia
Traits like height and blood pressure often follow this pattern, with most individuals clustering around the average and fewer individuals at the extremes.
Measuring Physical Attractiveness
Unlike measurable physical traits, attractiveness is inherently subjective. It’s influenced by cultural norms, personal preferences, and societal standards. Researchers typically measure attractiveness through:
- Rating Scales: Participants rate photographs or live subjects on a numerical scale.
- Ranking Tasks: Participants rank individuals from most to least attractive.
- Physiological Measures: Assessing responses like pupil dilation or brain activity when viewing attractive individuals.
Despite its subjectivity, studies have found high levels of agreement among raters, suggesting common standards of beauty exist across cultures (Langlois et al., 2000).
Is Attractiveness Normally Distributed?
Evidence Supporting Normal Distribution
Some studies suggest that attractiveness ratings follow a normal distribution:
- Inter-Rater Consistency: Research indicates that when large groups rate attractiveness, the distribution of scores tends to be symmetrical (Grammer & Thornhill, 1994).
- Cultural Universality: Certain features, such as facial symmetry and clear skin, are universally considered attractive, contributing to a normal distribution curve.
Evidence of Skewed Distribution
Contrasting studies reveal skewed distributions:
- Online Dating Data: Analysis of dating app interactions shows that a small percentage of highly attractive individuals receive the majority of attention, indicating a positive skew (Kefi et al., 2020).
- Gender Differences: Women often rate a smaller proportion of men as highly attractive compared to men’s ratings of women, leading to a left-skewed distribution for male attractiveness (Rudder, 2014).
Factors Influencing the Distribution of Attractiveness
Evolutionary Perspectives
- Mate Selection Strategies: Evolutionary psychology suggests that women are more selective due to higher parental investment, which may result in stricter criteria for male attractiveness (Buss & Schmitt, 1993).
- Desirability Bias: Individuals may overrate their own attractiveness or desirability, affecting how they perceive others (Gabriel et al., 1994).
Sociocultural Factors
- Media Influence: Media portrayals of beauty can skew perceptions, often highlighting extreme levels of attractiveness.
- Cultural Standards: Different cultures emphasize various traits, affecting the overall distribution of what’s considered attractive.
Implications of a Non-Normal Distribution
Understanding that attractiveness may not be normally distributed has significant implications:
- Dating Dynamics: A skewed distribution can explain why certain individuals receive disproportionate attention on dating platforms.
- Self-Esteem Issues: Unrealistic standards may lead to dissatisfaction and mental health concerns among those who perceive themselves as less attractive.
- Social Inequality: Perceptions of attractiveness can impact employment opportunities and social mobility, perpetuating inequality.
Rethinking Attractiveness Assessments
To gain a more accurate understanding of attractiveness distribution:
- Holistic Approaches: Incorporate personality, charisma, and other non-physical traits into assessments.
- Diversified Samples: Use diverse populations in studies to account for cultural and individual differences.
- Advanced Metrics: Employ biometric data and machine learning to analyze patterns in attractiveness perceptions.
Summarum
While physical attractiveness is a subjective trait influenced by numerous factors, evidence suggests that it may not follow a perfect normal distribution. Skewed perceptions, particularly influenced by gender differences and societal factors, indicate a more complex pattern. Recognizing this complexity is essential for addressing social dynamics and promoting a healthier understanding of beauty.
References
- Buss, D. M., & Schmitt, D. P. (1993). Sexual strategies theory: An evolutionary perspective on human mating. Psychological Review, 100(2), 204-232.
- Gabriel, S., Critelli, J. W., & Ee, J. S. (1994). Narcissistic illusions in self-evaluations of intelligence and attractiveness. Journal of Personality, 62(1), 143-155.
- Grammer, K., & Thornhill, R. (1994). Human (Homo sapiens) facial attractiveness and sexual selection: The role of symmetry and averageness. Journal of Comparative Psychology, 108(3), 233-242.
- Kefi, H., Prashad, A., & Perron-Brault, A. (2020). The paradox of choice in online dating: The effects of choice overload on mate preferences. Computers in Human Behavior, 104, 106153.
- Langlois, J. H., et al. (2000). Maxims or myths of beauty? A meta-analytic and theoretical review. Psychological Bulletin, 126(3), 390-423.
- Rudder, C. (2014). Dataclysm: Who We Are When We Think No One’s Looking. Crown Publishing Group.